Time Series Forecasting with PatchTST: Why Classical Models Are No Longer Enough
In many organizations, time series forecasting is still a patchwork of disconnected tools. Data is prepared in an ETL pipeline, features are engineered in notebooks, models are versioned in a separate training job, and forecasts later appear as CSV files, dashboards, or isolated APIs. That can work technically, but it is fragile scientifically and operationally: small changes in sampling frequency, missing-value handling, feature lags, or backtest boundaries can materially change measured model quality.
Dynamic markets, volatile supply chains, energy prices, production loads, and financial signals need more than an isolated forecasting model. Modern forecasting systems must treat data quality, feature engineering, training, evaluation, monitoring, and delivery as one lifecycle. This is where the NexPatch approach with Orpheon comes in: forecasting becomes a reproducible platform process rather than a notebook result.

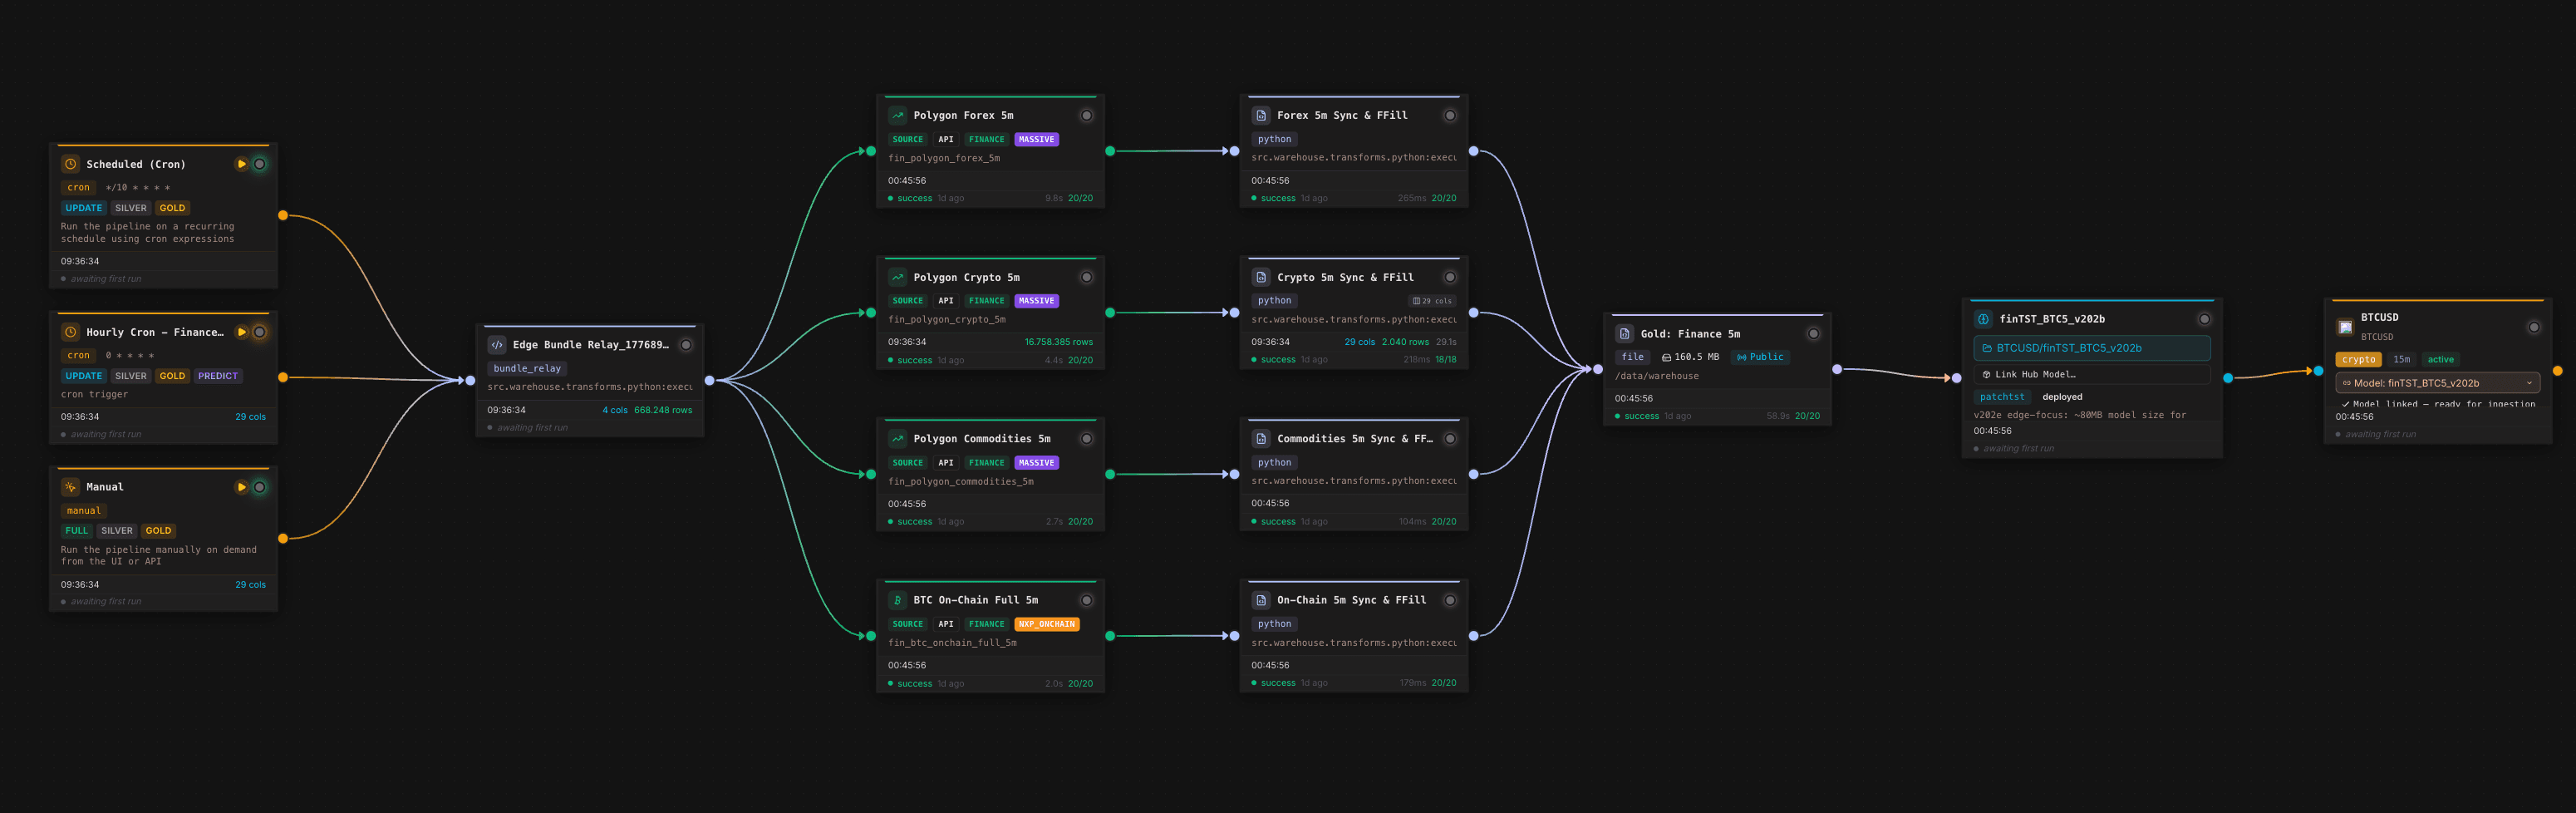
The canvas shows the operational core. Scheduled and manual triggers start the same data flow, multiple financial and on-chain sources are synchronized, transformation nodes harmonize data on a 5-minute grid, a Gold Layer node writes the trainable feature table, and a model node connects the downstream forecasting model. For forecasting, this matters because model quality is not only produced by architecture. It is produced by the repeatability of the entire data chain.
Why ARIMA and Prophet will remain useful, but no longer sufficient
ARIMA, SARIMA, exponential smoothing, and Prophet are still useful. They are interpretable, fast to set up, and often sufficient for univariate time series with stable seasonal patterns. A typical example is a single demand series with weekly and yearly seasonality, limited outliers, and few external drivers.
The problem starts when the forecasting environment becomes more realistic:
- Multiple assets, product lines, or sensors influence one another.
- External variables affect the target with delays.
- Signals are non-stationary and change regime.
- The forecast horizon is long enough that local patterns and long-range context both matter.
- Data continuously arrives from APIs, warehouses, files, or operational systems.
Classical models can represent parts of this setting, but often only with substantial manual feature work. Data scientists have to build lags, manage exogenous variables, handle missing values, tune models per series, maintain backtests separately, and then attach deployment logic. The bottleneck is not just accuracy. It is the toolchain.
PatchTST: patches instead of individual time steps
PatchTST changed the discussion around long-term time series forecasting because it does not treat every time step as an individual token. Instead, historical sequences are split into overlapping windows. These patches contain local patterns, reduce the effective sequence length, and make Transformer architectures more practical for longer horizons.
The key advantage is that the model does not need to process every single measurement in isolation. A patch may summarize the last 16 or 32 observations of a signal. This gives the model short-term movement, local volatility, outliers, and trend shifts in a compact context. Compared with earlier Transformer variants, patch-based tokenization reduces the burden of long sequences and can stabilize the learning problem.
In NexPatch projects, we do not use this idea as a pure paper implementation. We adapt it into a production-oriented topology for multivariate forecasting systems. One clarification is important: our approach is not reduced to treating channels as strictly independent. The key objective is to detect correlations across time and assets.
This includes:
- Lag features: Which signals lead or follow the target series?
- Cross-lag relationships: Does asset A today move asset B in 15, 60, or 240 minutes?
- Inter-feature correlations: Which combinations of price, volume, calendar, macro, on-chain, or operational data explain future behavior?
- Regime changes: When do correlations change, for example around market events, campaigns, load peaks, or seasonal breaks?
This separates the productive NexPatch angle from a purely channel-independent reading. The architecture should not only identify local sequence patterns, but also make delayed and cross-asset relationships usable.
Scientific framing: what modern benchmarks actually measure
Time series benchmarks are sensitive. A comparison between ARIMA, Prophet, Gradient Boosting, N-BEATS, Temporal Fusion Transformer, or PatchTST is meaningful only when data splits, forecast horizon, feature availability, and error metrics are clearly defined. The literature repeatedly shows three points:
- Long-horizon forecasting rewards models that compress context efficiently. PatchTST addresses this by using patches as tokens and making longer historical windows more manageable.
- Multivariate forecasts require clear feature timestamps. Exogenous variables must be used in backtests only as they would be available at forecast time in production. Otherwise, leakage is introduced.
- One metric is rarely enough. MAE and RMSE evaluate absolute errors, MAPE can become unstable near zero, sMAPE is more robust, and quantile losses matter when uncertainty or asymmetric risk is important.
For NexPatch, the decisive claim is not "Transformers are better." The decisive claim is reproducible evaluation: rolling-origin backtesting, fixed baselines, identical data windows, documented feature lags, separated validation and test periods, and an operational metric aligned with the decision.
Feature engineering as part of the model system
Many forecasting initiatives do not fail at the first model. They fail at the second, third, and tenth production run. Once a model has to run regularly, a team needs more than training code:
- Data sources must be connected reliably.
- Raw data needs validation, normalization, and history.
- Features must be generated reproducibly.
- Backtests must run against fixed baselines.
- Models must be versioned and monitored.
- Forecasts must reach operational systems.
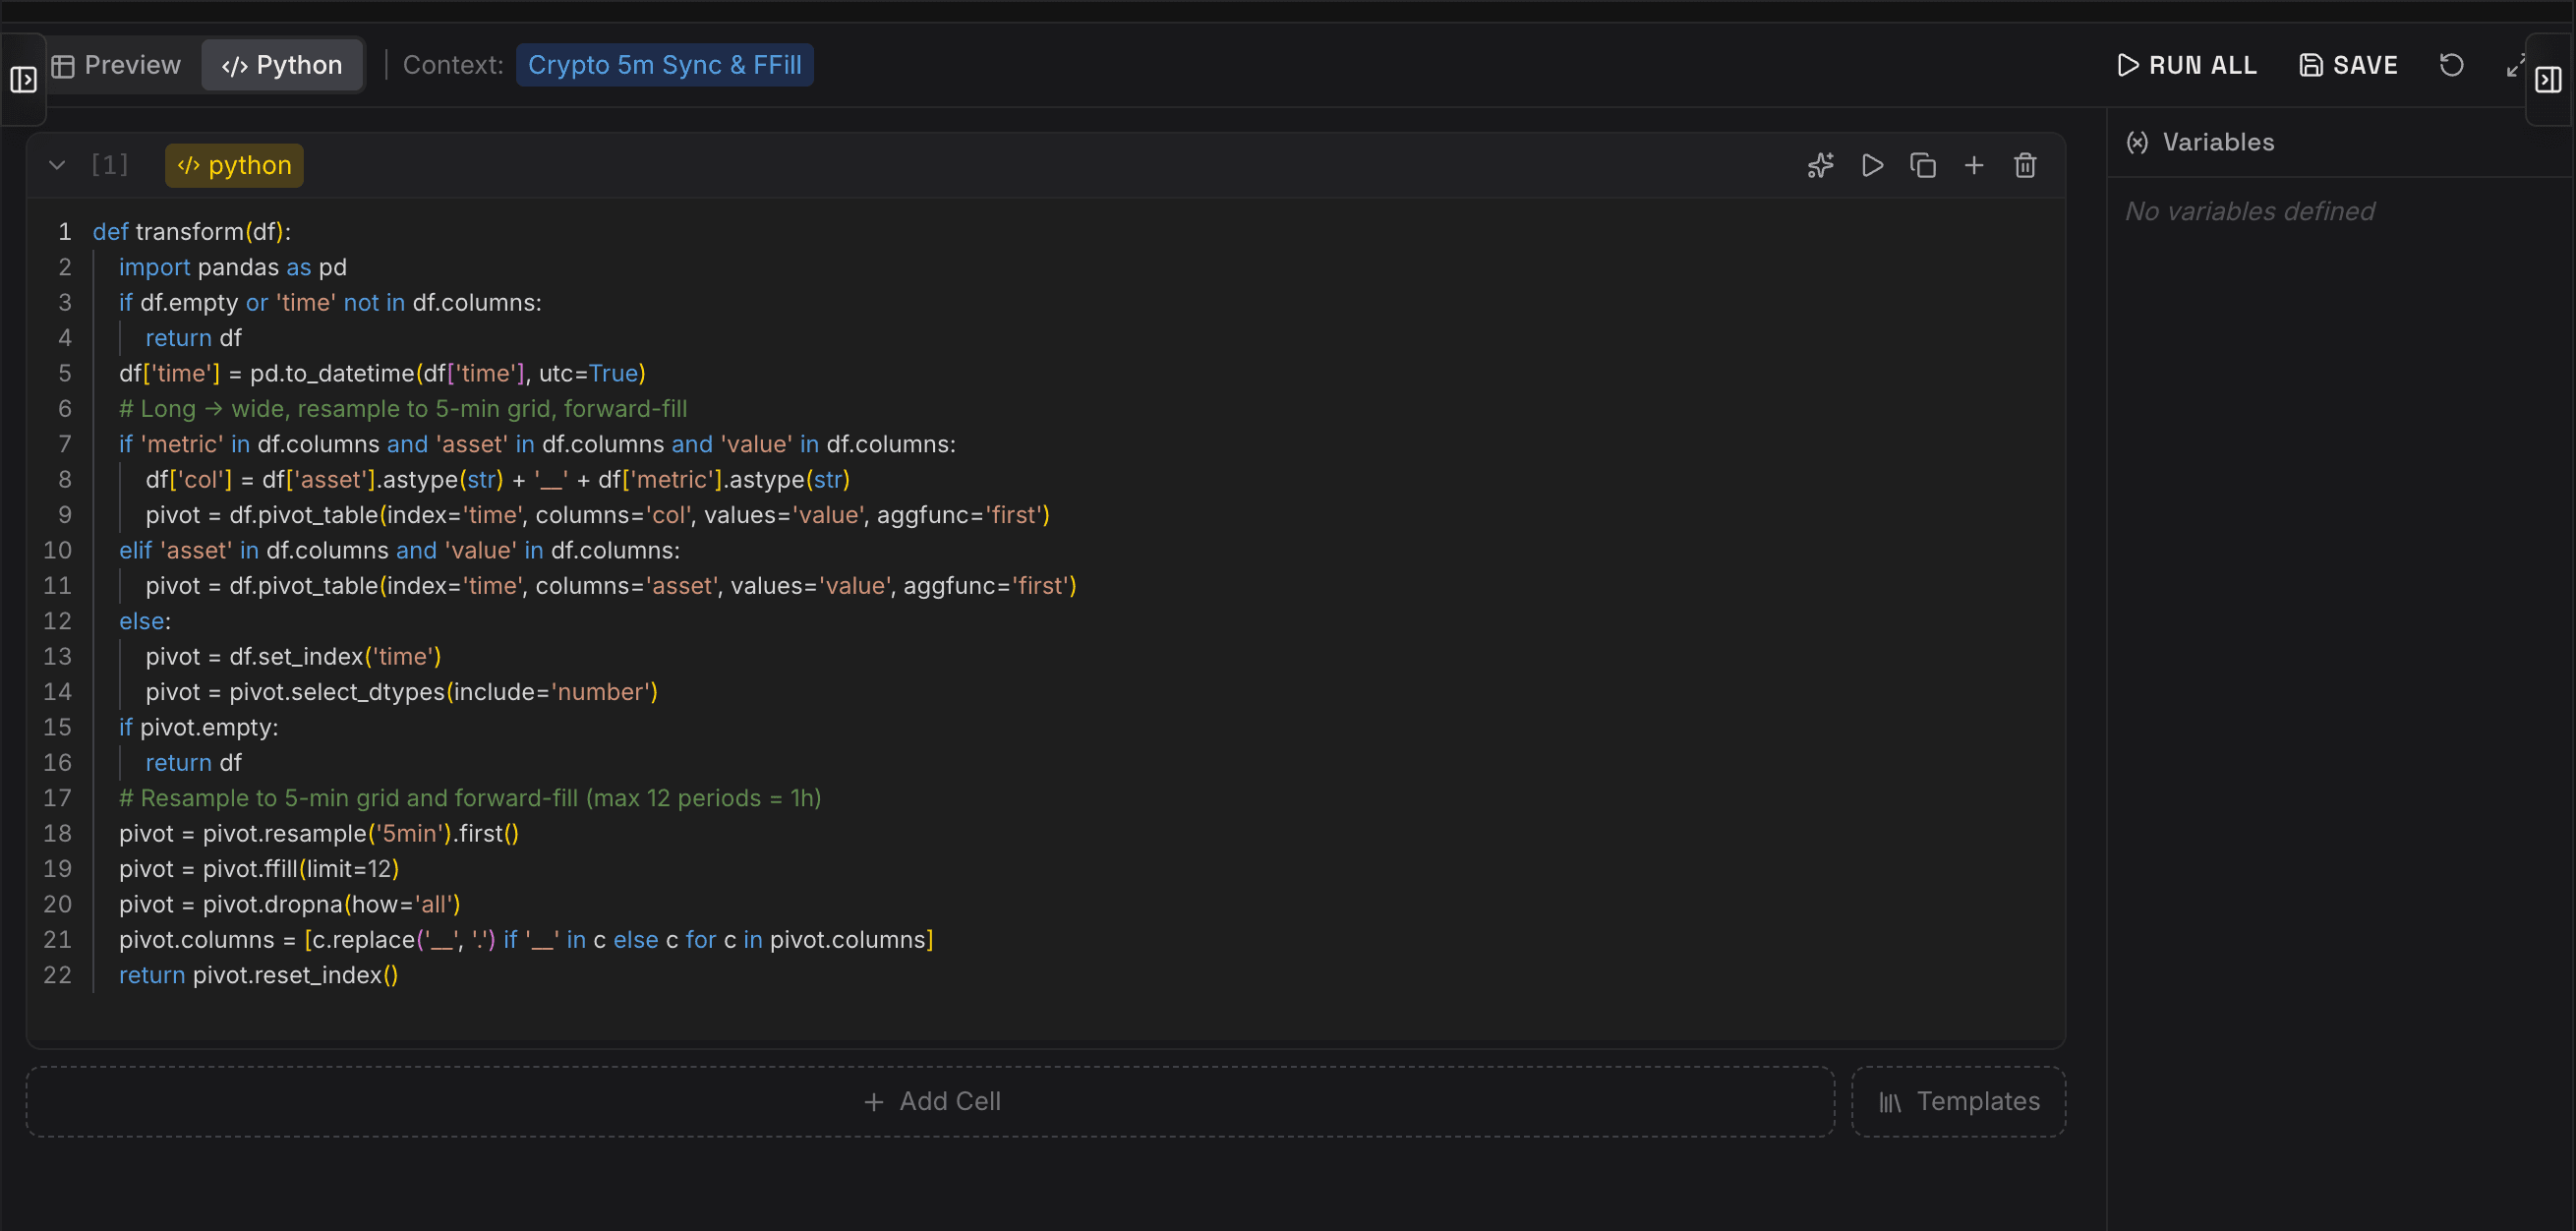
The editor screenshot shows a typical example. Raw data is pivoted by time, asset, metric, and value, resampled to a 5-minute grid, and forward-filled with a strict limit. These details may look small, but they are scientifically important. Overly aggressive forward filling can create artificial stability; incorrect resampling can shift lags; inconsistent pivoting can mix features between assets. Orpheon makes this logic explicit, versionable, and executable in the pipeline context.
Orpheon as a forecasting lifecycle, not just an ETL tool
The distinctive element of the NexPatch system is the combination of data platform and model topology. Orpheon treats forecasting not as an isolated ML job, but as a data product with a lifecycle.
A typical forecasting flow looks like this:
- Ingestion: APIs, files, warehouses, or near-streaming sources are connected.
- Transformation: Python or SQL logic cleans data, resamples time series, creates lags, fills gaps, and builds cross-asset features.
- Gold Layer: A consistent feature table is stored as a trainable foundation.
- Training: Patch-based Transformer models are trained on defined horizons, backtest windows, and baselines.
- Evaluation: Error metrics, drift, data quality, and run history become visible.
- Forecast API: Forecasts are not merely exported; they become API-ready data products.
The difference is fundamental: the model does not live next to the platform. It lives inside it. Forecasts become repeatable, versionable, and usable by applications, dashboards, agents, and operational workflows.
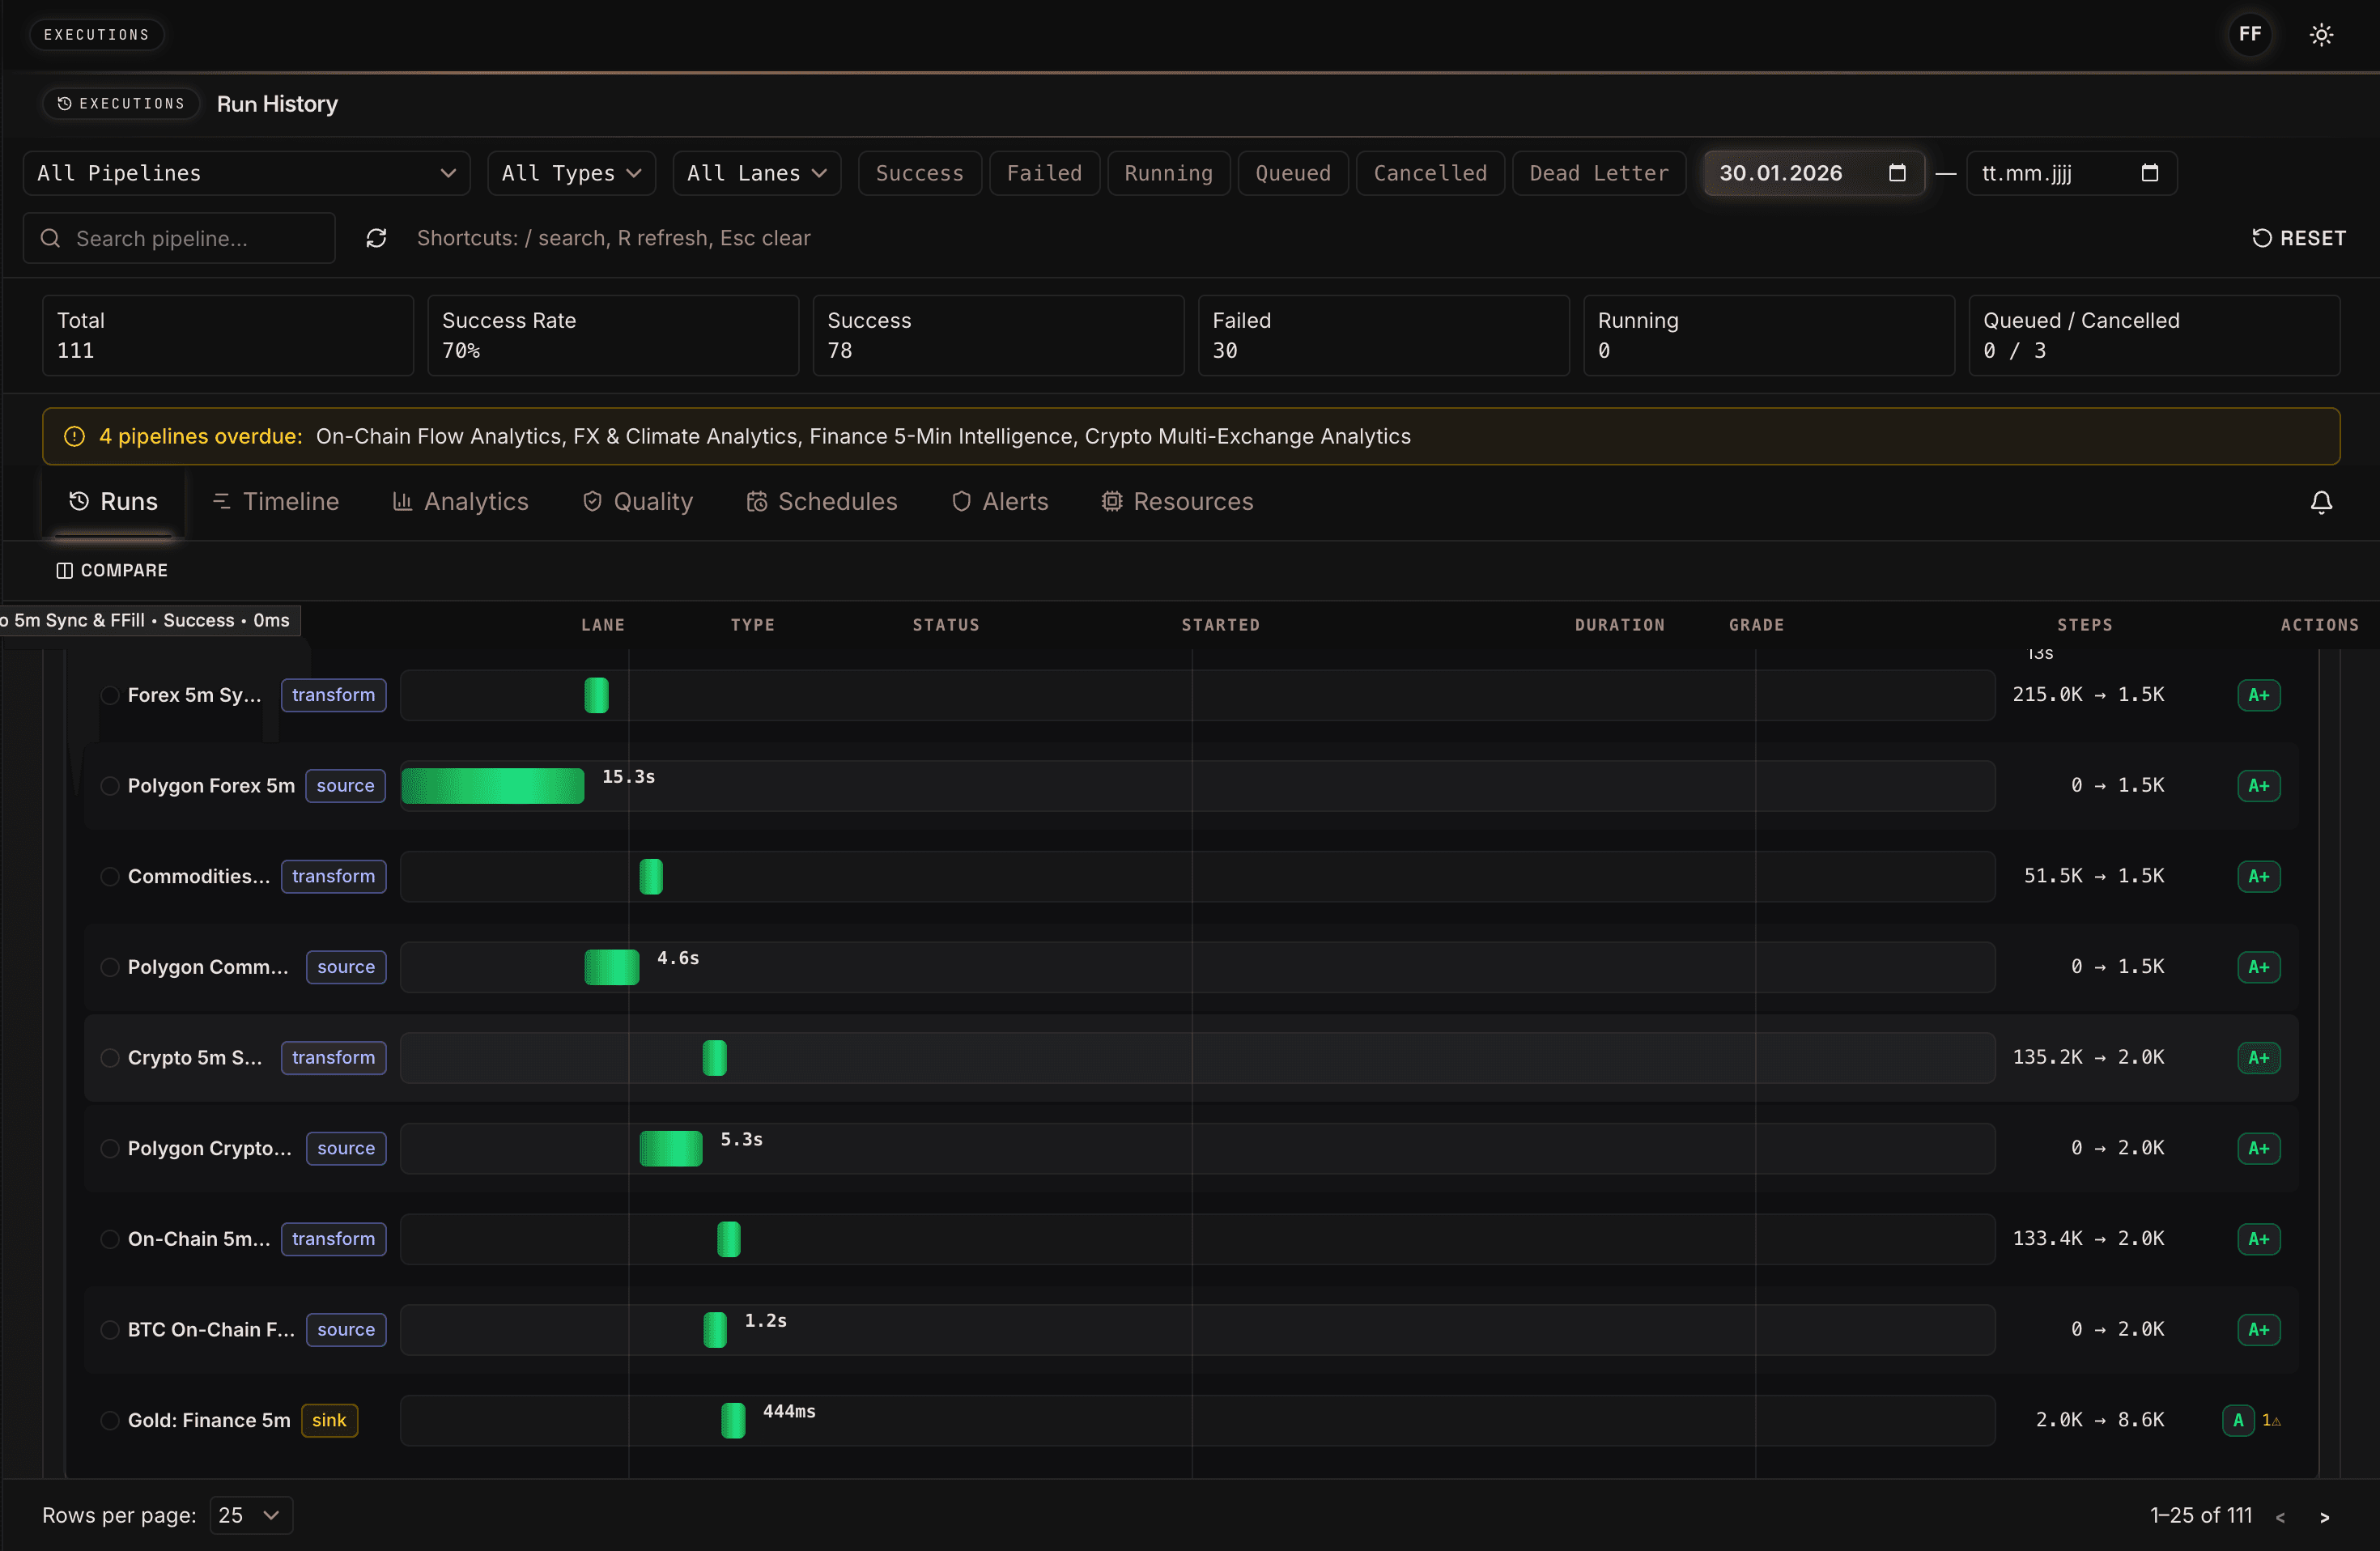
The execution view shows how Orpheon not only runs individual pipeline steps, but makes them observable. Sources, transformations, and sinks receive runtimes, status, row counts, and quality grades. For forecasting, this is more than DevOps convenience. It is the basis for auditing training data and future predictions: which source was slow, which transformation reduced rows, and which run produced the Gold Layer used for training?
Why lag and inter-feature correlations matter
In real forecasting scenarios, the target series is rarely explainable on its own. Demand may be influenced by campaigns, weather, inventory, and price actions. Energy signals depend on weather, calendars, load profiles, and market prices. Financial signals may react to volume, volatility, related assets, on-chain metrics, or external liquidity indicators.
The key question is not only what happened in the target series. It is also which signals indicated something earlier.
This is where lag features and inter-feature correlations matter. A signal does not have to act simultaneously. It can lead, lag, matter only in specific regimes, or reinforce other features. A modern PatchTST topology can learn such patterns across historical windows and feature groups, while the platform ensures that these features are computed and monitored consistently.
15-30 percent better forecasts: how to read the number responsibly
A 15-30 percent accuracy improvement is not a universal promise for every dataset. It is a realistic target and experience range when a modern patch-based Transformer is evaluated against classical baselines such as ARIMA, Prophet, seasonal naive forecasts, or simple Gradient Boosting setups, and when the underlying data is rich enough.
The distinction matters:
- Public PatchTST benchmarks show that patch-based Transformers perform strongly on many long-horizon datasets against classical and earlier Transformer models.
- Customer-specific NexPatch evaluations must always be measured against the concrete baseline, forecast horizon, data quality, and operating cost.
- The best architecture has limited value if features are unstable or if the production path does not deliver forecasts on time.
A strong forecasting pilot therefore starts not with a model claim, but with benchmark design: Which baseline counts? Which horizon matters? Which error metrics are business-relevant? And how quickly must the forecast be available in the target system?
Monitoring: from model accuracy to operational reliability
Data scientists often start with MAPE, MAE, RMSE, or quantile errors. Technical decision makers additionally ask: how reliably does the system run, how auditable is it, how quickly can a new asset, product, or plant be onboarded, how secure is API access, and how much manual maintenance remains?
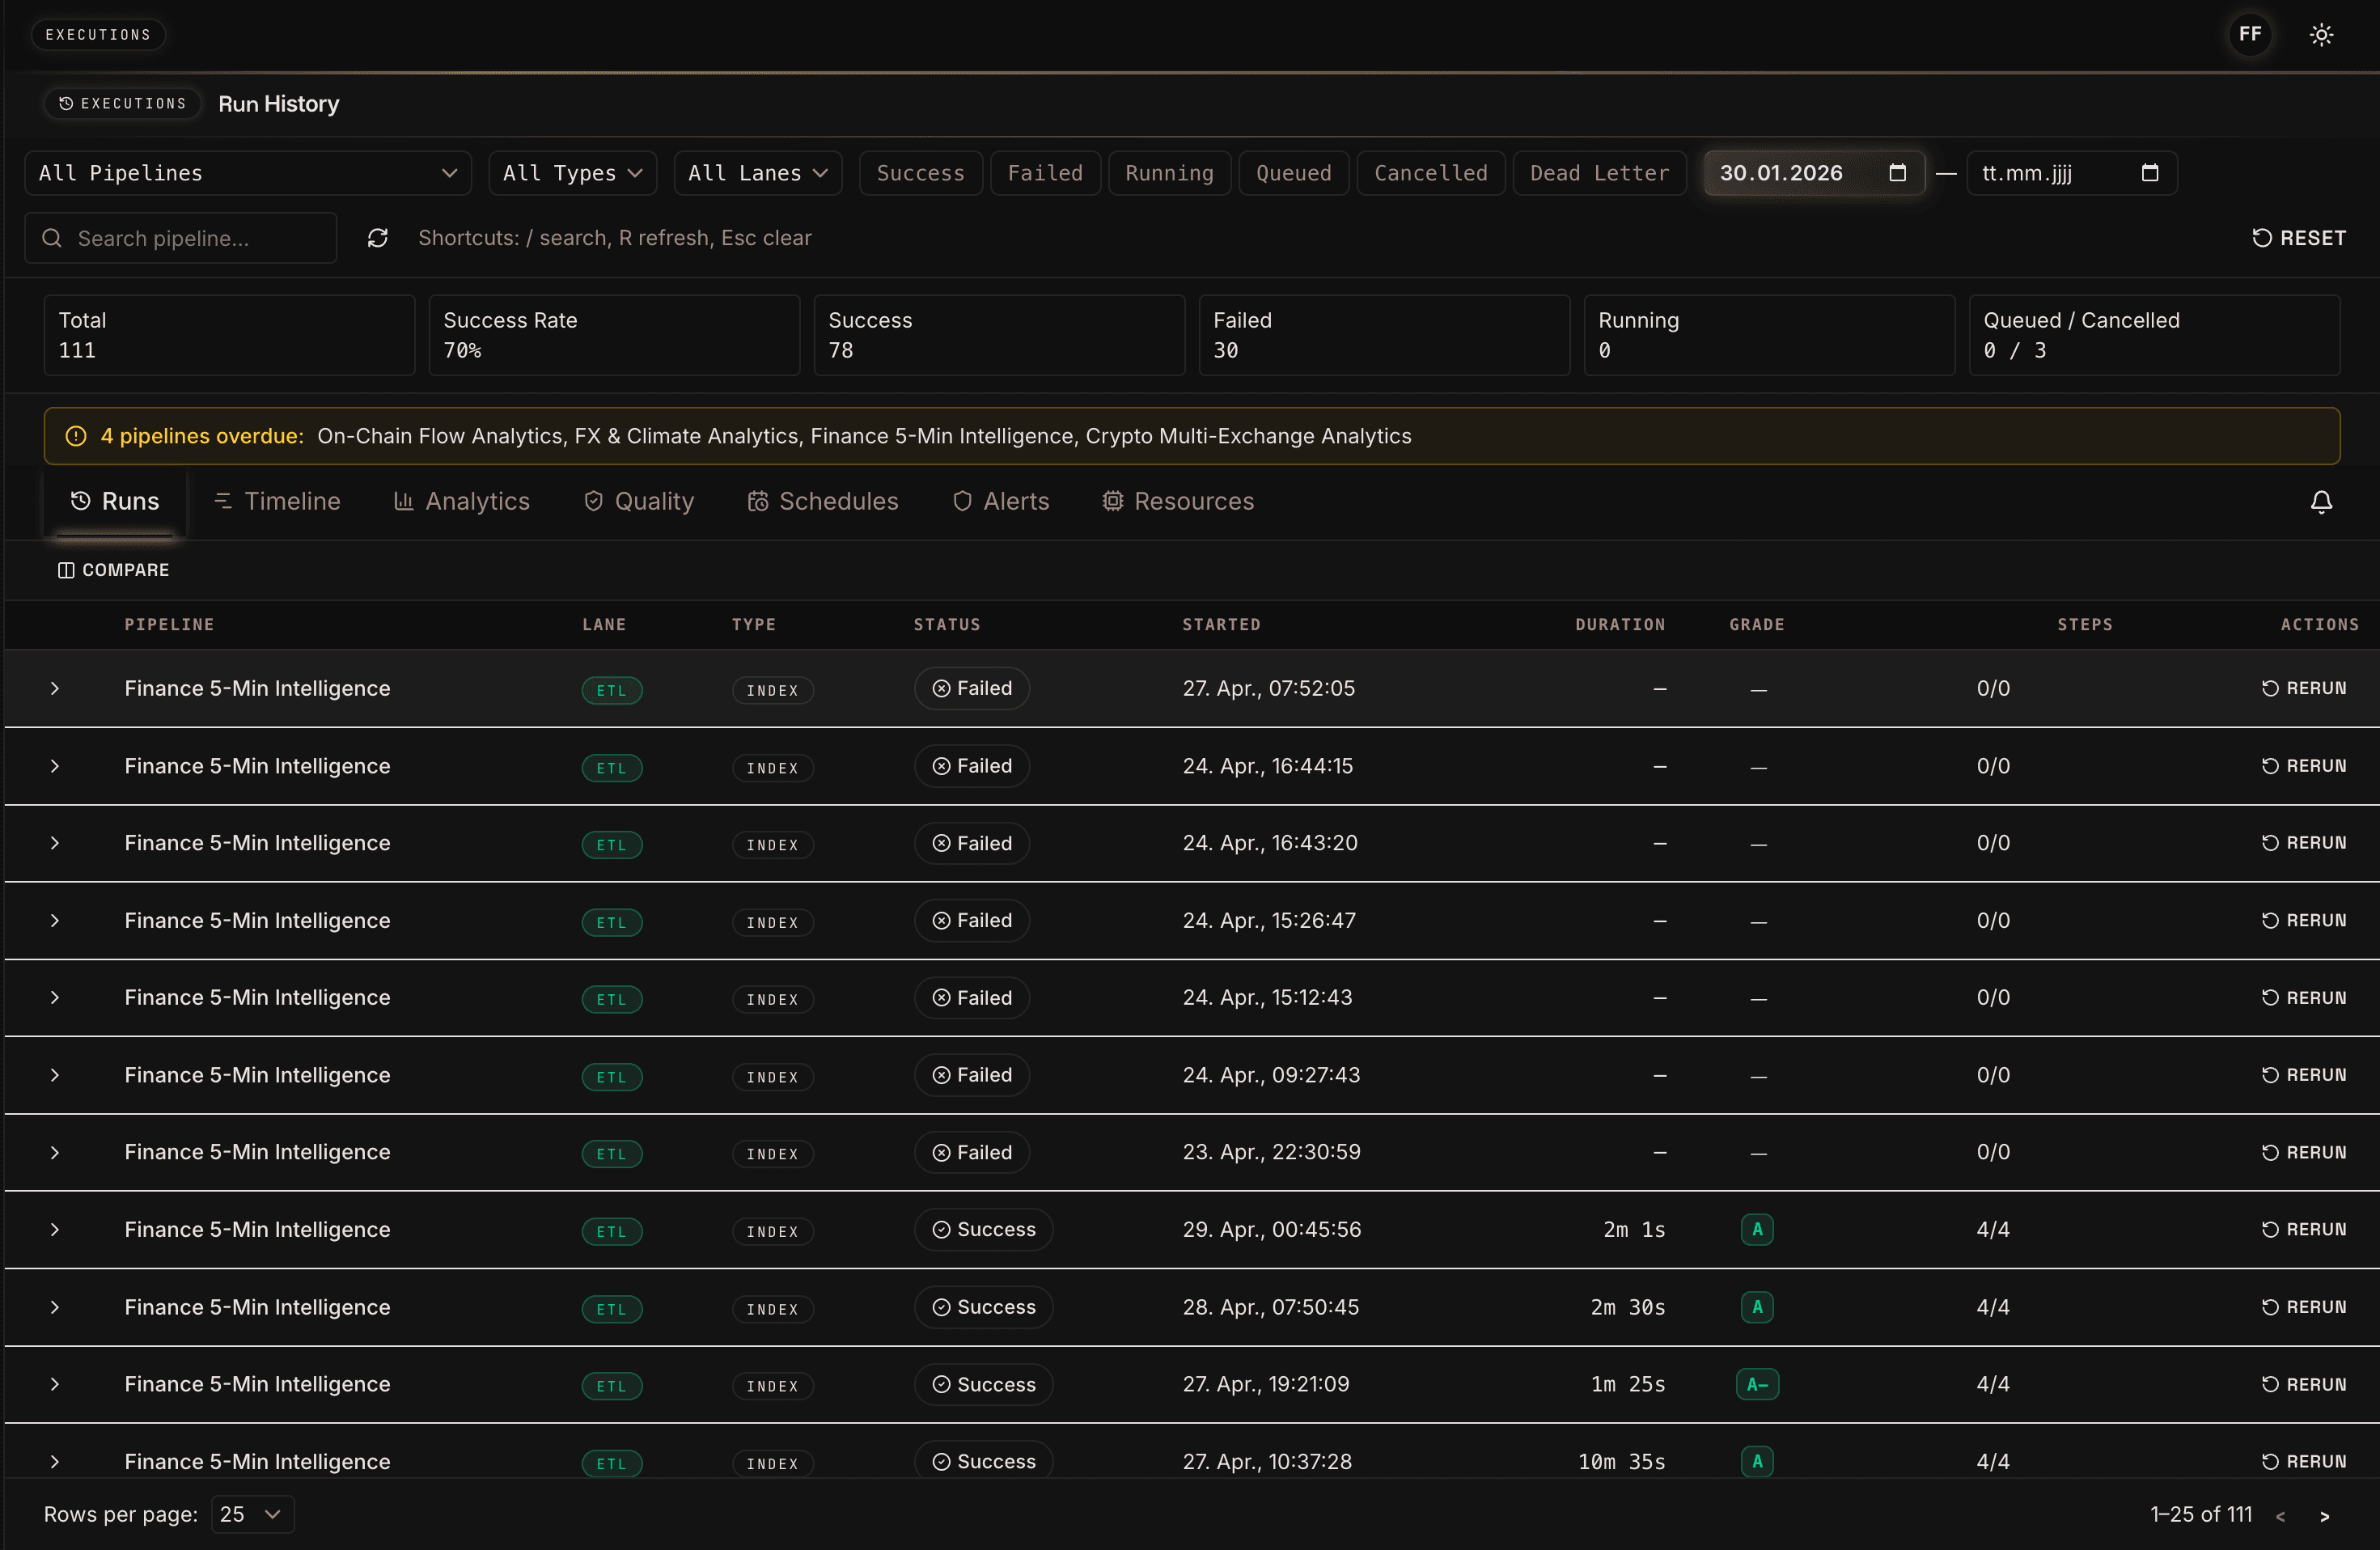
The run history makes clear that forecasting systems are not just model artifacts. They are recurring production processes. Success rate, failed runs, overdue warnings, and rerun actions help teams include data freshness and pipeline stability in model evaluation. A forecast with high offline accuracy is of limited value if the data run fails before market close or the Gold Layer is not updated in time.
Forecasts as API-ready data products
Many systems stop at model training. Orpheon continues further: the Gold Layer and derived forecasts can be provided as controlled data products. This is especially important when predictions are consumed not only in a dashboard, but by agents, applications, ERP systems, trading engines, or automated workflows.
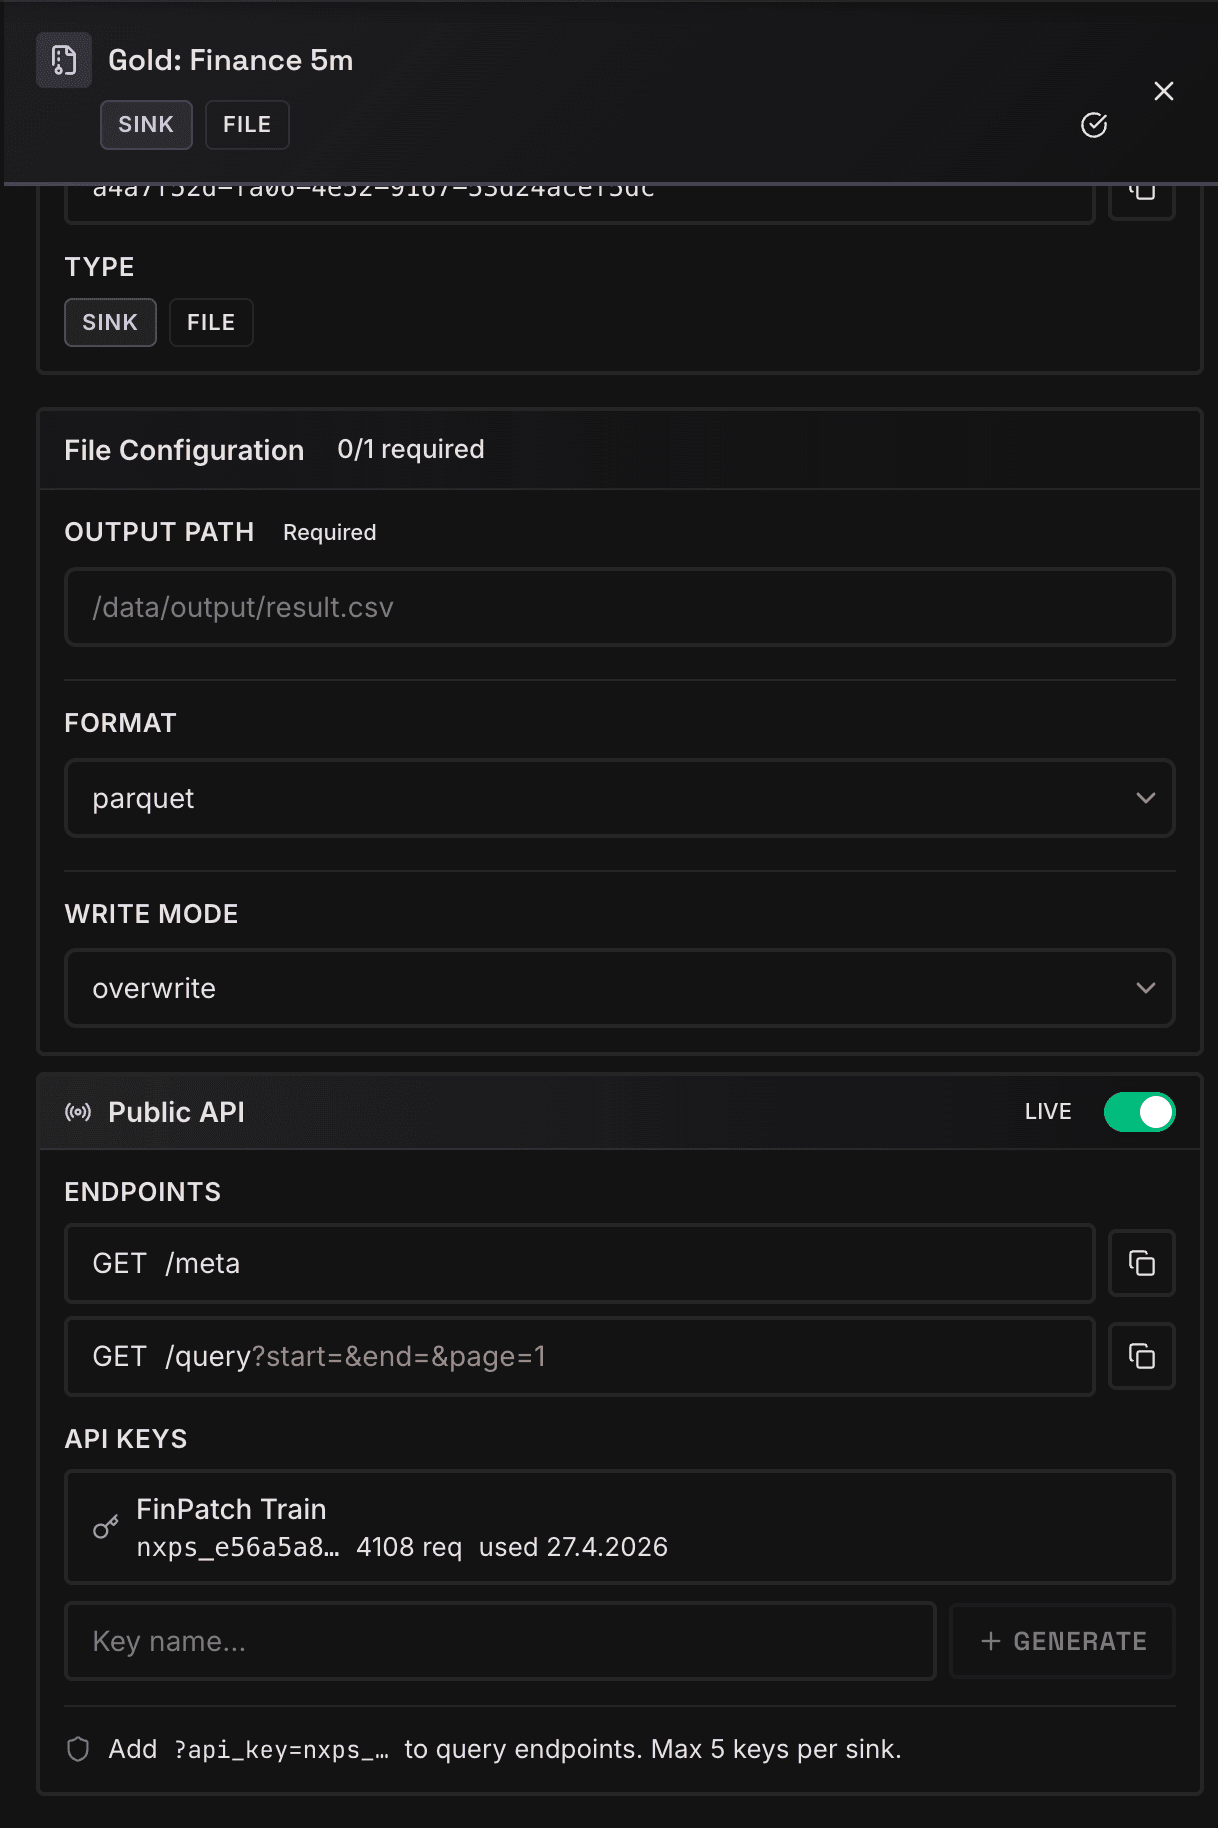
The Gold configuration screenshot shows the bridge between data engineering and production usage. Output format, write mode, Public API switch, meta and query endpoints, and API keys are managed in the same place. Forecasting is therefore not treated as a file drop, but as a queryable, secured, and versionable data product.
Implementation checklist for teams
Teams that want to make time series forecasting production-grade in 2026 should answer five questions before selecting a model:
- Which data sources are stable enough for training and production?
- Which lags and external features are plausible and available at forecast time?
- Which classical baseline is fair: ARIMA, Prophet, seasonal naive, or an existing internal model?
- Which metric truly decides: error across all timestamps, error at peaks, asymmetric decision risk, or process cost?
- How are forecasts delivered: dashboard, API, agent, ERP, trading system, or automated workflow?
Only then does the necessary model complexity become clear. PatchTST is powerful when long historical windows, many features, cross-asset dependencies, and longer horizons matter. For simple and stable single-series problems, a classical baseline may still be the better first choice.
Conclusion
Classical forecasting models are no longer enough when companies need not only better predictions, but production-grade forecasting systems. Patch-based Transformers such as PatchTST improve the ability to learn long context, local patterns, and delayed relationships. The real leverage emerges when these models are embedded into a platform that jointly operates ETL, feature engineering, training, evaluation, monitoring, and forecast delivery.
The NexPatch approach with Orpheon is built for that path: forecasting becomes a continuous data product instead of an isolated model. The model detects lag features, cross-asset dependencies, and inter-feature correlations. The platform ensures that these insights are trained reproducibly, monitored, and made usable as API-ready forecasts.
References
- Nie, Y., Nguyen, N. H., Sinthong, P., and Kalagnanam, J. (2023): A Time Series is Worth 64 Words: Long-term Forecasting with Transformers. ICLR 2023. arXiv:2211.14730.
- Lim, B., Arik, S. O., Loeff, N., and Pfister, T. (2021): Temporal Fusion Transformers for Interpretable Multi-horizon Time Series Forecasting. International Journal of Forecasting.
- Oreshkin, B. N., Carpov, D., Chapados, N., and Bengio, Y. (2020): N-BEATS: Neural basis expansion analysis for interpretable time series forecasting. ICLR 2020.
- Taylor, S. J., and Letham, B. (2018): Forecasting at Scale. The American Statistician.
- Box, G. E. P., Jenkins, G. M., Reinsel, G. C., and Ljung, G. M. (2015): Time Series Analysis: Forecasting and Control. Wiley.
- Hyndman, R. J., and Athanasopoulos, G. (2021): Forecasting: Principles and Practice. 3rd edition, OTexts.
- Makridakis, S., Spiliotis, E., and Assimakopoulos, V. (2022): M5 accuracy competition: Results, findings, and conclusions. International Journal of Forecasting.
- Zeng, A., Chen, M., Zhang, L., and Xu, Q. (2023): Are Transformers Effective for Time Series Forecasting? AAAI 2023.
- Wu, H., Xu, J., Wang, J., and Long, M. (2021): Autoformer: Decomposition Transformers with Auto-Correlation for Long-Term Series Forecasting. NeurIPS 2021.
- NexPatch Orpheon: product perspective on ETL, feature engineering, training, monitoring, and forecast delivery as a unified platform.